shapes layer tutorial
Welcome to the tutorial on the napari Shapes layer!
This tutorial assumes you have already installed napari, know how to launch the viewer, and are familiar with its layout. For help with installation see our installation tutorial. For help getting started with the viewer see our getting started tutorial. For help understanding the organisation of the viewer, including things like the layers list, the layer properties widgets, the layer control panels, and the dimension sliders see our napari viewer tutorial.
This tutorial will teach you about the napari Shapes layer,
including how to display and edit shapes like rectangle, ellipses, polygons, paths, and lines.
At the end of the tutorial you should understand how to add a shapes layer
and edit it from the GUI and from the console.
The points layer allows you to display a list of an NxD arrays, where each array corresponds to one shape, specified by N points in D coordinates. You can adjust the position, size, face color, edge color, and opacity of all the shapes independently, both programmatically and from the GUI.
a simple example
You can create a new viewer and add a list of shapes in one go using the napari.view_shapes method,
or if you already have an existing viewer, you can add shapes to it using viewer.add_shapes.
The api of both methods is the same.
In these examples we’ll mainly use add_shapes to overlay shapes onto on an existing image.
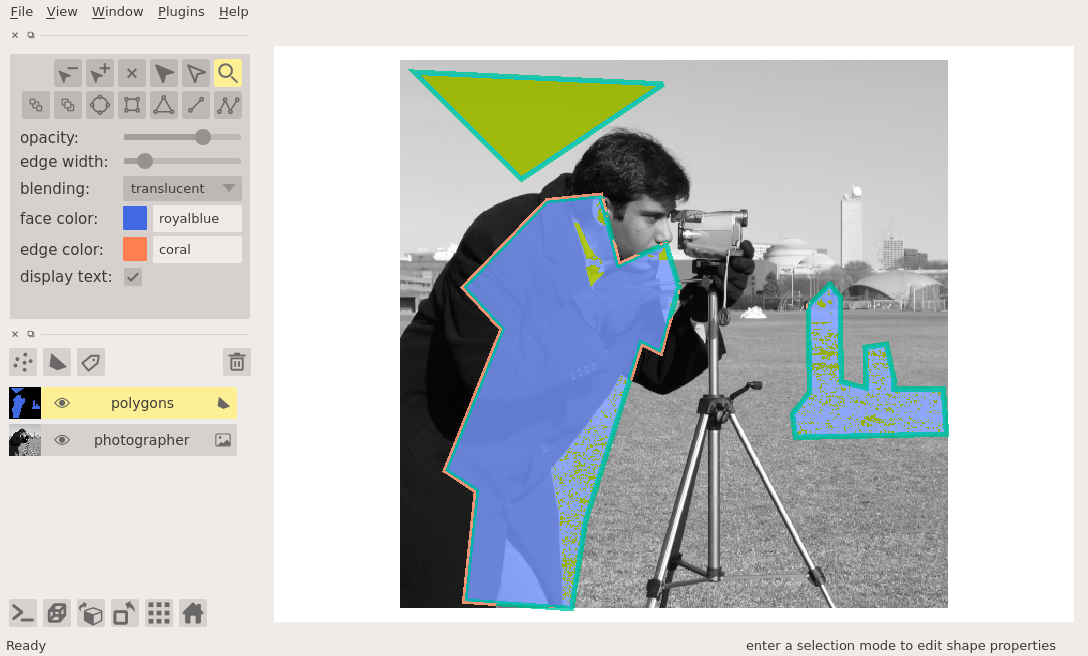
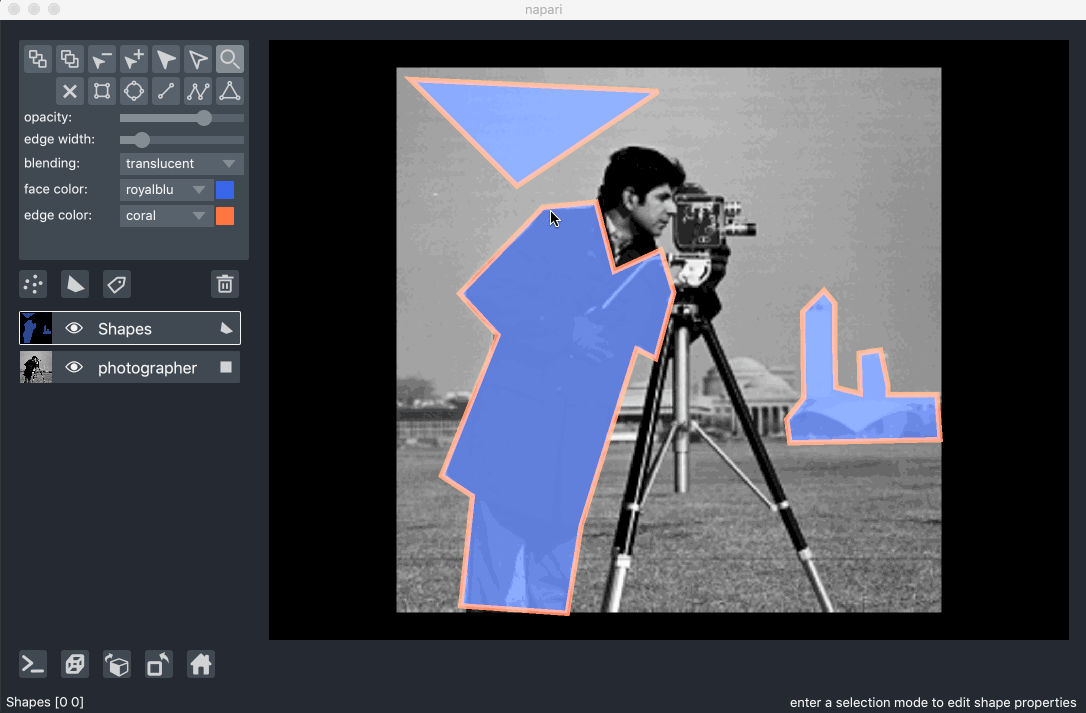
In this example of we will overlay some shapes on the image of a photographer:
%gui qt # we need to start the Qt event loop before importing napari
ERROR:root:Invalid GUI request 'qt # we need to start the Qt event loop before importing napari', valid ones are:dict_keys(['inline', 'nbagg', 'notebook', 'ipympl', 'widget', None, 'qt4', 'qt', 'qt5', 'wx', 'tk', 'gtk', 'gtk3', 'osx', 'asyncio'])
import napari
import numpy as np
from skimage import data

# create the list of polygons
triangle = np.array([[11, 13], [111, 113], [22, 246]])
person = np.array([[505, 60], [402, 71], [383, 42], [251, 95], [212, 59],
                   [131, 137], [126, 187], [191, 204], [171, 248], [211, 260],
                   [273, 243], [264, 225], [430, 173], [512, 160]])
building = np.array([[310, 382], [229, 381], [209, 401], [221, 411],
                     [258, 411], [300, 412], [306, 435], [268, 434],
                     [265, 454], [298, 461], [307, 461], [307, 507],
                     [349, 510], [352, 369], [330, 366], [330, 366]])
polygons = [triangle, person, building]

# add the image
viewer = napari.view_image(data.camera(), name='photographer')

# add the polygons
layer = viewer.add_shapes(polygons, shape_type='polygon', edge_width=5,
                          edge_color='coral', face_color='royalblue')
WARNING: QStandardPaths: XDG_RUNTIME_DIR not set, defaulting to '/tmp/runtime-runner'
WARNING:vispy:QStandardPaths: XDG_RUNTIME_DIR not set, defaulting to '/tmp/runtime-runner'
from napari.utils import nbscreenshot

nbscreenshot(viewer)
arguments of view_shapes and add_shapes
Both view_shapes and add_shapes have the following doc strings:
napari.view_shapes?
shapes data
The input data to the shapes layer must be a list of NxD numpy array,
with each array containing the coordinates of the N vertices in D dimensions that make up the shape.
The ordering of these dimensions is the same as the ordering of the dimensions for image layers.
This list of arrays is always accessible through the layer.data property
and will grow or shrink as new shapes are either added or deleted.
By storing data as a list of arrays
it is possible for each shape to have a different number of vertices in it.
This is especially useful when drawing polygons or paths.
adding different shape types
Right now the shapes layer supports 5 types of shapes,
Lines, Rectangles, Ellipses, Polygons, and Paths.
When adding new data can set the shape type through the shape_type keyword argument,
as either a single shape type if all the shapes to be added have the same type
or as a list of shape types if some of the shapes have different types.
The actual shape types of all the shapes is accessible through the layer.shape_types property.
Selecting different shape creation tools will cause shapes of the different types to be added.
Lines consist of two vertices representing the end points of the line.
The line creation tool can be selected from the layer control panel
or by pressing the L key when the shapes layer is selected.
When adding a new line
the first click will coordinates of the first endpoint
and the second click will mark the coordinates of the second endpoint.
You’ll then be able to add another line.
Rectangles can be added using two vertices representing the corners of the rectangle for axis aligned rectangle,
or using four corners so that non-axis aligned rectangle can be represented too.
Internally we use the four vertex representation so we can always support rotated rectangles.
The rectangle creation tool can be selected from the layer control panel
or by pressing the R key when the shapes layer is selected.
When adding a rectangle you must click and drag the rectangle to have the desired shape.
When you release the mouse the rectangle will be completed
and you’ll then be able to add another one.
If you just make a single click
then a rectangle of default size will be created centered on that click.
Ellipses can be added using either two vectors,
one representing the center position of the ellipse
and the other representing the radii of the ellipse in all dimensions for an axis aligned ellipse,
or by using the four corners of the ellipse bounding box for a non-axis aligned ellipse.
Internally we use the four vertex representation so we can always support rotated ellipses.
The ellipse creation tool can be selected from the layer control panel
or by pressing the E key when the shapes layer is selected.
When adding an ellipse you must click and drag the ellipse to have the desired shape.
When you release the mouse
the ellipse will be completed
and you’ll then be able to add another one.
If you just make a single click
then an ellipse of default size will be created centered on that click.
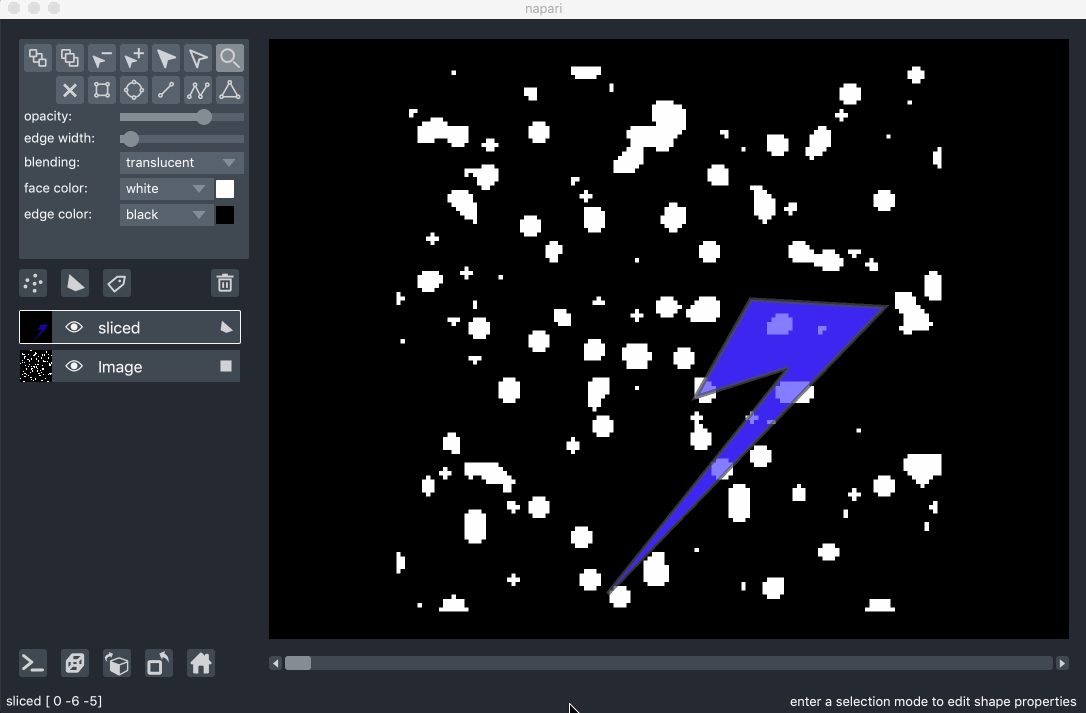
Polygons can be added using an array of N vertices.
Polygons are closed by default,
and so you don’t also need to include the first point at the end of the array.
The order of the vertices will determine the triangulation of the polygon,
which can be non-convex, but cannot have holes.
The polygon creation tool can be selected from the layer control panel
or by pressing the P key when the shapes layer is selected.
When adding a polygon
each click will add a vertex at the clicked location.
To finish drawing a polygon you must click the escape key,
which will add a final vertex at the current mouse position and complete the polygon.
You’ll then be able to start adding another one.
Paths are like polygons but are not closed or filled in.
They can also be added using an array of N vertices.
The path creation tool can be selected from the layer control panel
or by pressing the T key when the shapes layer is selected.
When adding a path each click will add a vertex at the clicked location.
To finish drawing a path you must click the escape key,
which will add a final vertex at the current mouse position and complete the path.
You’ll then be able to start adding another one.
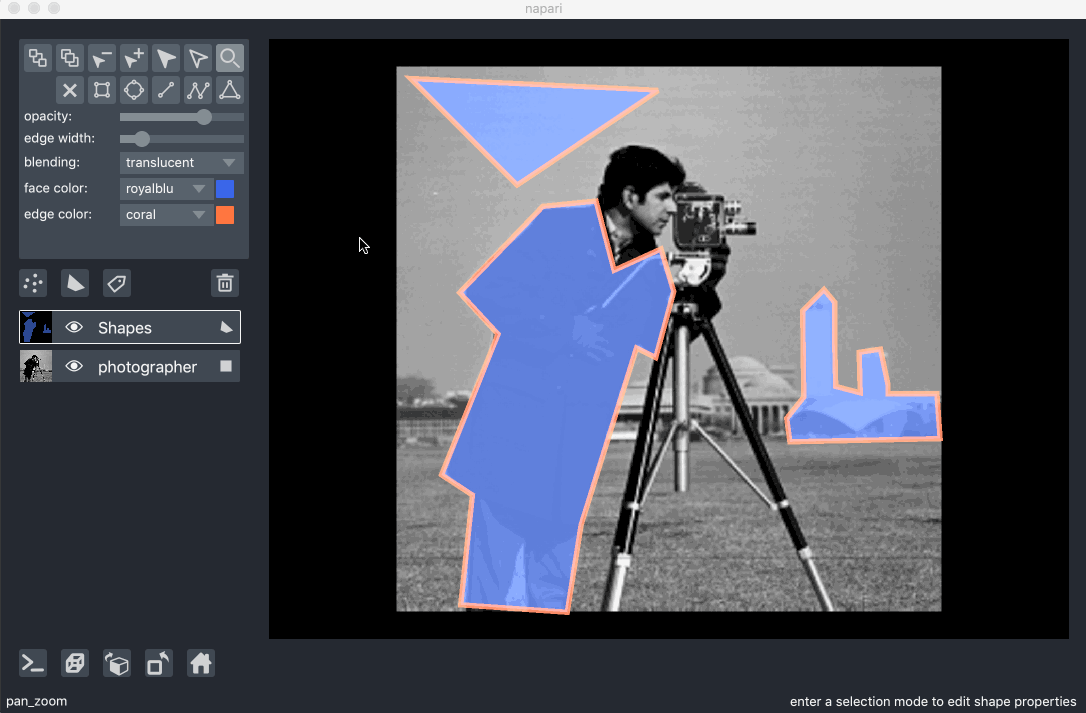
When using the shapes addition or editing tools the pan and zoom functionality of the viewer canvas is disabled and you can edit the layer. You can temporarily re-enable pan and zoom by pressing and holding the spacebar. This feature can be useful if you want to move around the shapes layer as you edit it.
creating a new shapes layer
As you can add new shapes to a shapes layer using the various shape creation tools, it is possible to create a brand-new empty shapes layers by clicking the new shapes layer button above the layers list. The shape of the shapes layer is defined by the shapes inside it, and so as you add new shapes the shape will adjust as needed. The dimension of the new shapes layer will default to the largest dimension of any layer currently in the viewer, or to 2 if no other layers are present in the viewer.
non-editable mode
If you want to disable editing of the shapes layer
you can set the editable property of the layer to False.
As note in the section on 3D rendering, when using 3D rendering the shapes layer is not editable.
3D rendering of shapes
All our layers can be rendered in both 2D and 3D mode,
and one of our viewer buttons can toggle between each mode.
The number of dimensions sliders will be 2 or 3 less than the total number of dimensions of the layer.
See for example the examples/nD_shapes.py to see shapes in both 2D and 3D:
Note though that when entering 3D rendering mode the shape editing tools are all disabled. Those options are only supported when viewing a layer using 2D rendering.
Also note that for a multidimensional shape to be displayed on a given view slice all of its non-displayed coordinates must match the coordinates of that view slice, i.e. the shape must be entirely defined within that plane.
For paths that are defined by coordinates spanning more than two dimensions,
it is possible to visualize them as 3D cylinders, see for example the examples/3D_paths.py
Right now, it is not possible to display 3D cuboids or 3D spheroids, but will be supporting those options soon.
pan and zoom mode
The default mode of the shapes layer is to support panning and zooming, as in the image layer.
This mode is represented by the magnifying glass in the layers control panel,
and while it is selected editing the layer is not possible.
Continue reading to learn how to use some of the editing modes.
You can always return to pan and zoom mode by pressing the Z key
when the shapes layer is selected.
selecting, resizing, moving, and deleting shapes
New shapes can be added using one of the 5 shape creation tools,
for Lines, Rectangles, Ellipses, Polygons, and Paths.
For more information on the different shape types see the shape types section.
You can select a shape by clicking on it using the shape selection tool,
which can be selected by clicking on it in the layer controls panel
or by pressing the S key when the shapes layer is selected.
Once selected you can move the shape by dragging it.
You can also resize the shape by clicking and dragging on one of the handles along the edge of the shape bounding box.
You can also rotate the shape by clicking and dragging on the rotation handle above the shape bounding box.
When resizing a layer if you hold down the shift key
the aspect ratio of the shape will lock and you can continue to resize the shape now with a fixed aspect ratio.
You can select multiple shapes by continuing to shift click on additional shapes after the first, or by dragging a bounding box around the shapes you want to select.
You can select all the shapes in the currently viewed slice by clicking the A key if you are in select mode.
Once selected you can delete the selected shapes by clicking on the delete button in the layer controls panel or pressing the delete key.
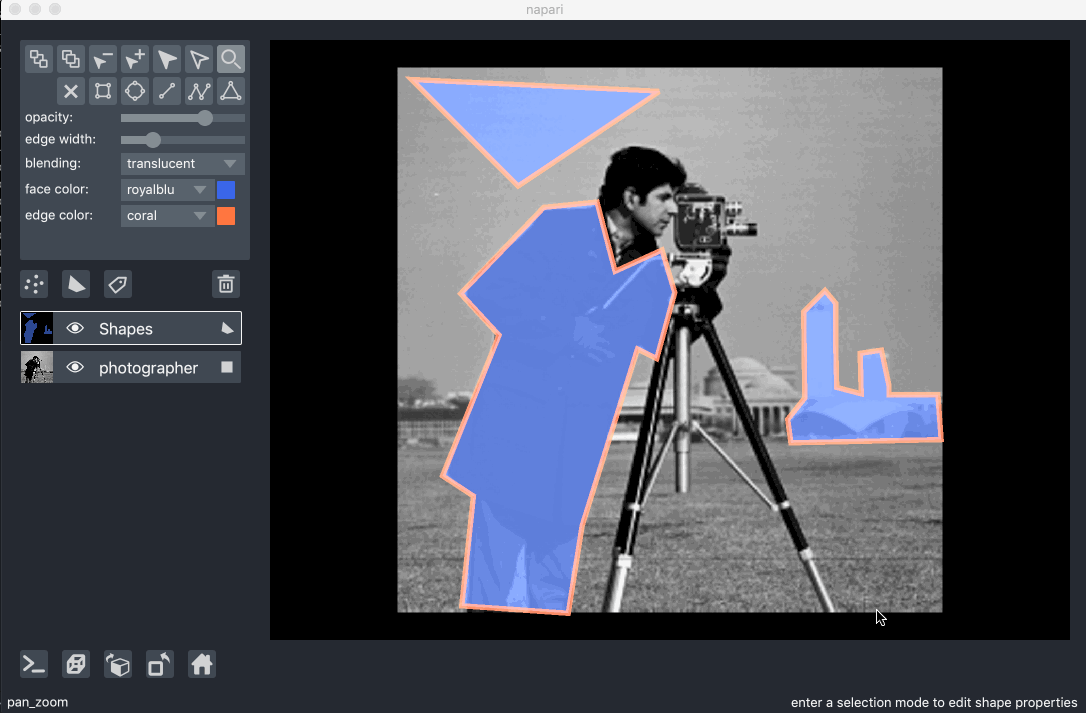
For example see below:
adding, moving, and deleting individual vertices
You can move individual vertices by entering the direct selection mode
by either clicking on the direct select tool in the layer controls panel
or pressing the D key while the shapes layer is selected.
To move a vertex, you can click and drag it to its new position.
You can add vertices to a selected shape using the vertex addition tool
which can be selected either clicking on the vertex addition tool in the layer controls panel
or pressing the I key while the shapes layer is selected.
You can delete vertices to a selected shape using the vertex deletion tool
which can be selected either clicking on the vertex deletion tool in the layer controls panel
or pressing the X key while the shapes layer is selected.
For example see below:
changing shape edge and face colors
Individual shapes can each have different edge and face colors.
You can initially set these colors by providing a list of colors to the edge_color or face_color keyword arguments respectively,
or you can edit them from the GUI.
The colors of each of the shapes are available as lists under the layer.edge_colors and layer.face_colors properties.
These properties are different from the layer.edge_color and layer.face_color properties
that will determine the color of the next shape to be added or any currently selected shapes.
To change the shape color properties from the GUI you must first select the shape whose properties you want to change, otherwise you will just be initializing the property for the next shape you add.
changing shape edge widths
Individual shapes can each have different edge widths.
You can initially set the edge widths by providing a list of values to the edge_width keyword arguments respectively,
or you can edit them from the GUI.
The widths of each of the shapes are available as a list under the layer.edge_widths property.
Similar to the edge and face colors, these property is different from the layer.edge_width property
that will determine the edge width of the next shape to be added or any currently selected shapes.
To change the edge with property from the GUI you must first select the shape whose properties you want to change, otherwise you will just be initializing the property for the next shape you add.
layer ordering
You can adjust the ordering of shapes in the layer
by selecting shapes and then clicking the move to front or move to back buttons.
You can get the ordering of all the shapes using the layer.z_indices property.
You can also set the initial ordering of shapes by passing a list to the layer.z_index property.
copying and pasting shapes
It is possible to copy and paste any selected shapes using the ctrl-C and ctrl-V keybindings respectively.
If you have a multidimensional shapes layer you can copy shapes from one slice to another
by pasting them into the new slice.
The coordinates of the shapes in the visible dimensions will be in the same place on the new slice as in the old slice,
but the rest of the coordinates will be updated with the new slice values.
layer visibility
All our layers support a visibility toggle that allows you to set the visible property of each layer.
This property is located inside the layer widget in the layers list and is represented by an eye icon.
layer opacity
All our layers support an opacity slider and opacity property
that allow you to adjust the layer opacity between 0, fully invisible, and 1, fully visible.
The opacity value applies individually to each shape in the layer,
and so you must have shapes selected for it to have an effect.
You can also initialize the shape opacities using the opacity keyword argument
which accepts either a list of opacities or a single opacity value that will be applied globally.
You can then access the opacity of every shape using the layer.opacities property.
Note that this property is different from the layer.opacity property
that determines the opacity of the next shape to be added.
blending layers
All our layers support three blending modes translucent, additive, and opaque
that determine how the visuals for this layer get mixed with the visuals from the other layers.
An opaque layer renders all the other layers below it invisible
and will fade to black as you decrease its opacity.
The translucent setting will cause the layer to blend with the layers below it if you decrease its opacity
but will fully block those layers if its opacity is 1.
This is a reasonable default, useful for many applications.
The final blending mode additive will cause the layer to blend with the layers below
even when it has full opacity.
This mode is especially useful for visualizing multiple layers at the same time.
naming layers
All our layers support a name property
that can be set inside a text box inside the layer widget in the layers list.
The name of each layer is forced into being unique
so that you can use the name to index into viewer.layers to retrieve the layer object.
scaling layers
All our layers support a scale property and keyword argument
that will rescale the layer multiplicatively according to the scale values (one for each dimension).
This property can be particularly useful for viewing anisotropic data
where the size of the voxel in the z dimension might be different then the size in the x and y dimensions.
translating layers
All our layers support a translate property and keyword argument
that you can use to offset a layer relative to the other layers,
which could be useful if you are trying to overlay two layers for image registration purposes.
layer metadata
All our layers also support a metadata property and keyword argument
that you can use to store an arbitrary metadata dictionary on the layer.
putting it all together
Here you can see an example of adding, selecting, and editing shapes and change their properties:
next steps
Hopefully, this tutorial has given you a detailed understanding of the Shapes layer,
including how to create one and control its properties.
To learn more about some of the other layer types that napari supports
checkout some more of our tutorials listed below.
The surface layer tutorial is a great one to try next as it describes rendering complex surfaces.